
DC / Energy Procurement / Latest
Why Are Pepco Electric Supply Rates Still Rising in 2026?
Pepco's DC supply rates rose again on July 1, 2026 - up 8.6% to 11.8% by rate class. See the new SOS rates, what's driving them, and how to budget.
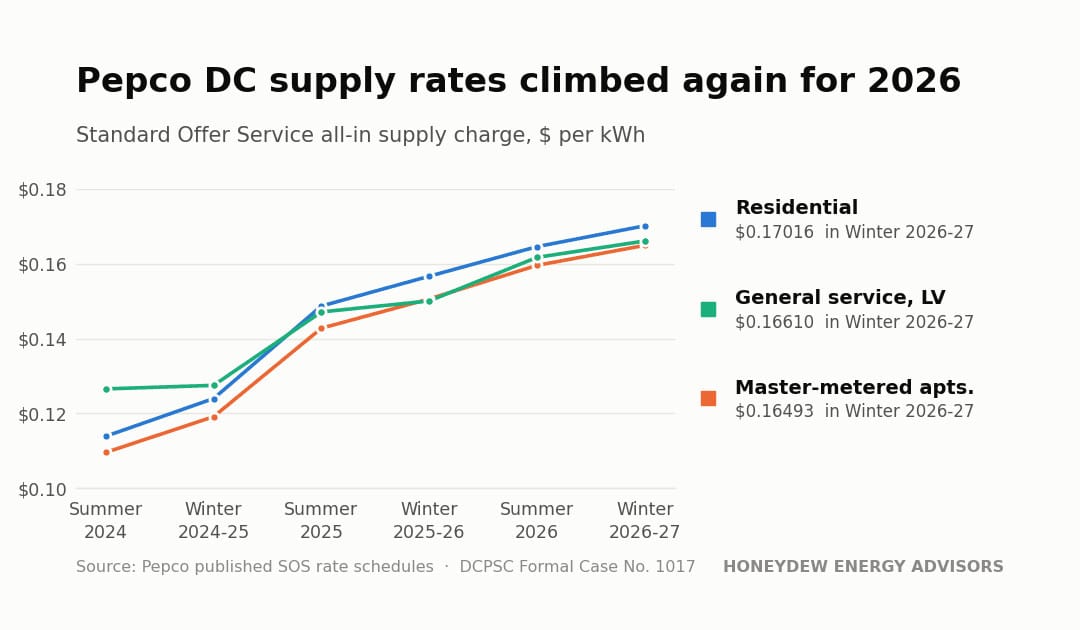
If you are a Pepco customer in the District of Columbia, the steady climb in your electricity bill since the pandemic is not over. On May 20, 2026, the Public Service Commission of the District of Columbia (DCPSC) approved another round of Standard Offer Service (SOS) supply-rate increases under Formal Case No. 1017, Order No. 22869. Pepco later deferred the start date by one month to refine its billing systems, so the new rates take effect July 1, 2026. For the second year in a row, most residential and commercial customer classes are paying more for the supply portion of their bill.
Important: These rates affect only the supply portion of your electric bill. Distribution charges, taxes, and other riders are billed separately and continue to be regulated by the DCPSC.
So what keeps pushing these rates higher? Ordinary inflation and seasonal swings are only part of it. Most of the pressure comes from the supply side of the grid: record PJM capacity prices, a wave of power-plant retirements across the region, rising demand from AI data centers, and the District’s growing renewable-energy requirements. Here is what the numbers actually show.
The Numbers: Supply Rates Climbed Again for 2026
Pepco’s SOS schedule sets all-in electricity supply charges (generation, transmission, and administrative) across several rate classes and two seasonal periods. Table A extends our earlier analysis with the newly approved Summer 2026 and Winter 2026-27 rates, which were set together in the same annual procurement covering June 2026 through May 2027. Every major class moved higher.
Table A. Published Pepco DC SOS supply rates ($/kWh), Summer 2024 through Winter 2026-27. The 2026 figures reflect the rates approved in DCPSC Order No. 22869. Summer covers the June through October billing months; Winter covers November through May.
Rate Class | Summer 2024 | Winter 2024-25 | Summer 2025 | Winter 2025-26 | Summer 2026 | Winter 2026-27 |
|---|---|---|---|---|---|---|
MMA | $0.10958 | $0.11913 | $0.14278 | $0.15060 | $0.15959 | $0.16493 |
R | $0.11390 | $0.12398 | $0.14871 | $0.15668 | $0.16459 | $0.17016 |
MGT LV | $0.11895 | $0.11978 | $0.14407 | $0.14586 | $0.15694 | $0.16062 |
GS LV | $0.12656 | $0.12751 | $0.14714 | $0.15007 | $0.16172 | $0.16610 |
GT LV | $0.11894 | $0.11977 | $0.14406 | $0.14585 | $0.15693 | $0.16061 |
GS LV ND | $0.10944 | $0.11062 | $0.14329 | $0.15071 | $0.15601 | $0.16167 |
Rate classes: MMA (Master Metered Apartment), R (Residential), MGT LV (Medium General Service, Low Voltage), GS LV (General Service, Low Voltage), GT LV (Large General Service, Low Voltage), GS LV ND (General Service, Low Voltage, Non-Demand).
Year-over-year changes
Table B converts those rates into percentage changes. Read it carefully, because the last column measures something different from the other three, and the difference matters for budgeting. We explain it in full below.
Table B. Percentage change in Pepco DC SOS supply rates. The first three columns compare one season to the same season a year earlier. The final column compares a full calendar year of billing to the prior calendar year, weighting each season by the number of months it applies and assuming equal monthly consumption.
Rate Class | Winter 2024-25 to | Summer 2025 to | Winter 2025-26 to | Calendar 2025 to |
|---|---|---|---|---|
MMA | 26.4% | 11.8% | 9.5% | 16.8% |
R | 26.4% | 10.7% | 8.6% | 16.1% |
MGT LV | 21.8% | 8.9% | 10.1% | 13.9% |
GS LV | 17.7% | 9.9% | 10.7% | 13.0% |
GT LV | 21.8% | 8.9% | 10.1% | 13.9% |
GS LV ND | 36.2% | 8.9% | 7.3% | 18.2% |
What the table shows
The 2026 increase lands on top of last year’s already steep jump. On a summer-to-summer basis, master-metered apartments rose the most (up 11.8%), followed by residential customers (up 10.7%). The commercial low-voltage classes saw smaller summer-to-summer increases, in the 8.9% to 9.9% range, but their winter rates climbed faster, rising about 10% year over year. Part of the commercial increase comes from a higher SOS administrative charge for large commercial customers, which more than doubled, rising from $0.00400 to $0.01020 per kWh.
On a full calendar-year basis, supply costs are up between 13% and 18% from 2025 to 2026 depending on the class. Stretching back further, all-in supply rates have risen between roughly 28% and 46% since Summer 2024.
For the average residential customer using 614 kWh per month, the DCPSC estimates the change adds about $9.56, or 7.0%, to the total monthly bill. Master-metered apartments see about 6.8% ($6.20), small commercial customers about 4.7%, and large commercial customers about 5.2%.
Why the Annual Increase Looks Bigger Than Either Seasonal Increase
Look at the master-metered apartment row in Table B and something appears wrong. Summer rates rose 11.8%. Winter rates rose 9.5%. Yet the calendar year rose 16.8%, which is larger than both. How can an annual change exceed every seasonal change that went into it?
All three figures are correct. They simply measure different pairs of periods, and the reason is that Pepco’s rate year does not line up with the calendar year.
A Pepco rate year runs from June through May. A calendar year therefore contains pieces of two different rate years:
- January through May is billed at the previous rate year’s winter rate.
- June through October is billed at the current summer rate.
- November and December are billed at the new rate year’s winter rate.
That first block is the key. When you compare calendar 2026 against calendar 2025, the January-through-May portion is not comparing the two most recent winters. It is comparing Winter 2025-26 against Winter 2024-25, which is the increase that took effect a year ago. For master-metered apartments, that earlier jump was 26.4%, and it applies to five of the twelve months in the comparison. That is what pulls the annual figure above both of the 2026 seasonal figures.
Worked example: Master Metered Apartments.
Calendar 2025 average = (5 × $0.11913 + 5 × $0.14278 + 2 × $0.15060) ÷ 12 = $0.13423
Calendar 2026 average = (5 × $0.15060 + 5 × $0.15959 + 2 × $0.16493) ÷ 12 = $0.15673
Change = 16.8%
The five winter months at the start of 2026 are billed at the Winter 2025-26 rate, which was already 26.4% above the rate that covered the start of 2025. That block does most of the work.
This is why we show the prior-winter column in Table B. Once you can see that last year’s winter increase ran between 17.7% and 36.2% depending on the class, the calendar-year figures stop looking strange.
What to do with this. The two seasonal columns tell you what changed at the meter on July 1. The calendar column tells you what happens to your annual energy budget, and in a rising market it lags, because you spend the first five months of every year still absorbing the prior year’s increase. Budget from the calendar column. Negotiate from the seasonal columns. If you are comparing a supplier quote against SOS, the seasonal rates are the right benchmark.
What’s Driving the Increases?
The DCPSC does not set generation prices. They are determined through competitive wholesale auctions. This year’s rates reflect contracts awarded in the December 2025 and January 2026 SOS auctions, plus a capacity adder tied to the 2026-2027 PJM Base Residual Auction. Several forces are converging.
Record PJM capacity prices. The 2026/27 PJM Base Residual Auction cleared at $329.17/MW-day across the entire PJM footprint, the FERC-approved cap price and the highest in PJM history, up about 22% from $269.92/MW-day the prior year. PJM Interconnection, the regional grid operator, hit the price cap as it struggled to meet reliability targets amid tightening supply.
Data-center demand, and why Virginia’s growth lands on a DC bill. This one causes confusion, so it is worth being precise. Northern Virginia’s data centers are not outside the regional grid pressing in on it. They are inside it. Dominion Energy Virginia has been a PJM member since 2005, and its service territory is a full PJM transmission zone. Loudoun County’s “Data Center Alley” sits in that zone, in the same capacity market Pepco buys from.
PJM builds a single reliability requirement for the entire footprint from one regional load forecast, then procures capacity against a regional supply stack. Demand growth concentrated in one zone therefore raises the clearing price for every zone, including Pepco’s. And the concentration is extreme: weather-normalized baseload in the Dominion zone has grown roughly 6.5% per year since 2021, about four times the PJM-wide average of 1.63%. PJM attributed a year-over-year increase of more than 5,400 MW in forecast peak load for the 2026/27 delivery year largely to data-center expansion, electrification, and economic growth.
The scale of the effect is not speculative. Monitoring Analytics, PJM’s independent market monitor, estimated that data centers were responsible for 63% of the capacity price increase in the 2025/26 auction, amounting to roughly $9.3 billion in additional costs recovered from customers across PJM in a single delivery year.
Power-plant retirements. Older generation across the PJM footprint continues to retire faster than new capacity comes online. That squeezes the supply-demand balance and lifts wholesale prices.
Renewable mandates. District renewable-energy requirements contribute to supply costs, though wholesale market conditions remain the dominant driver.
On top of all this, growing liquefied natural gas exports may place upward pressure on domestic natural gas prices over time, although weather and production levels remain major drivers. Natural gas is still the largest single fuel source for electricity generation.
A note of balance. Rates are not guaranteed to keep climbing at this pace, and there is early evidence of a plateau. PJM’s most recent capacity auction, for the 2027/28 delivery year, cleared at $333.44/MW-day. That is a third consecutive record, but it is only about 1.3% above the prior year, compared with the 22% increase the year before. New generation projects, transmission upgrades, or lower natural gas prices could moderate costs further. Electricity markets remain inherently cyclical.
How Honeydew Helps You Take Control
As supply rates keep climbing, good guidance pays for itself. Honeydew Energy Advisors manages over 1,000 utility accounts and helps building owners navigate DC and Maryland benchmarking and BEPS compliance while reducing energy costs through procurement, solar, and efficiency strategies. Whether you operate a multifamily building or a commercial portfolio, we can benchmark your accounts against our portfolio, compare supplier rates and help you lock in more competitive fixed electricity contracts, support solar adoption through rooftop or community solar, administer your Energy Star Portfolio Manager reporting, and recommend efficiency upgrades that lower consumption over the long term.
We also serve as your ongoing energy advocate. We track market trends and Pepco filings so you stay ahead of the next change, we negotiate on your behalf, and we explain what shifting rates mean for your budget.
Looking Ahead
As AI, electrification, and LNG exports keep scaling, their effect on electricity costs will keep growing. Pepco’s rising rates reflect that larger shift, and they are a good reason for consumers to get more deliberate about how they buy and use power. The future is electric, but it does not have to be unpredictable. With Honeydew Advisors on your side, you can plan around rate increases instead of reacting to them.
Call us at 202-670-9625 to talk to an advisor.