
Washington D.C.’s Building Energy Performance Standards (BEPS) set a threshold for building energy efficiency, measured by the Energy Star Score. Surprisingly, using natural gas on-site can boost this score more than using an equivalent amount of electrical energy. This presents a conundrum as D.C. moves towards electrification of buildings, even planning to ban natural gas in new constructions from 2026.
Understanding the Efficiency of Natural Gas vs Electricity
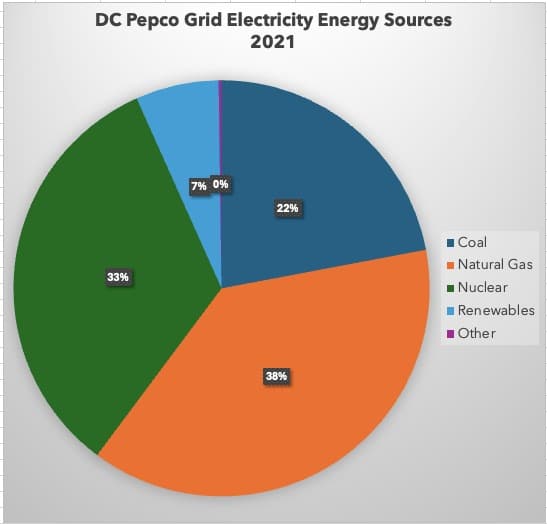
The impact on Energy Star Scores stems from the energy lost when transmitting electricity, known as line losses. The Department of Energy notes that to deliver 1 kilowatt-hour (kWh) of electricity to a building, 2.8 kWh needs to be generated. In contrast, delivering 1 therm of natural gas energy requires just 1.05 therms. Given Pepco’s energy mix, which as of 2021 included 38% natural gas and 22% coal, with a mere 7% from renewables, the weighting of line losses in energy efficiency models is significant.
Case Study: The Impact of Energy Source Conversion
A study by Honeydew using the Energy Star Portfolio Manager for two D.C. properties illustrates the stark impact of switching energy sources. Converting a portion of energy consumption from natural gas to electricity and vice versa showed dramatic shifts in Energy Star Scores. Notably, a conversion from electric to natural gas improved a building’s score from 61 to 72, moving it from failing to passing BEPS cycle 1.
It’s important to highlight that such changes don’t affect the Site EUI (Energy Usage Intensity) but significantly impact the Source EUI, reflecting the broader energy consumption needed for electricity delivery.
Strategies for Electrification Without Compromising Efficiency
For buildings looking to electrify while maintaining or improving their Energy Star Score, incorporating on-site solar energy can mitigate line loss impacts. Solar energy directly consumed on-site counts as 100% renewable and does not suffer from transmission losses, contrasting with Pepco’s limited renewable energy share. Pairing solar with high-efficiency heating systems like Variable Refrigerant Flow (VRF) systems and heat pumps can further enhance energy scores.
For building managers in D.C. contemplating electrification in line with BEPS and seeking to understand its impact on their Energy Star Score, Honeydew offers modeling services to explore potential outcomes.
For more detailed analysis and assistance, contact Andrew at Honeydew Advisors (az@honeydewadvisors.com).
Experiment A: Energy Star Score Decreases from 61 to 32 When Natural Gas Energy Converted to Electrical Energy
Building Characteristics for Condominium A: 40,140 sqft, built 1943
Baseline
- 2022 Energy Data shows 197,072 kWh and 20,327 therms or 672 mmBTU for grid electricity and 2032 mmBTU for gas. Total 2,705 mmBTU
- ESS 61, Source EUI: 100.2, Site EUI: 67.5
Test: Transfer 500 mmBTU from natural gas to electricity or decrease natural gas by 5,001 therms and increase grid kWh by 146,542. Assumes equal energy use efficiency
- Added 146,542 to June usage of 20,251.71 for 166,793.7 kWh
- Zeroed out February usage of 2,718.6. Subtracted 2,282.4 therms from March (2,345.9) to get 63.5 therms.
Results
- 2022 Energy Data shows 343,613 kWh and 15,325 therms or 1,172 mmBTU for grid electricity and 1,532 mmBTU for gas. Total is 2,705 mmBTU
- ESS 32, Source EUI: 122, Site EUI: 67.5
Experiment B: Energy Star Score Increases from 61 to 72 When Electrical Energy Converted to Natural Gas Energy
Building Characteristics for Condomium B: 150,169 sqft, built 2005
Baseline
- 2022 Energy Data shows 2,029,040 kWh and 16,290 therms or 6,923 mmBTU for grid electricity and 1,629 mmBTU for gas. Total 8,552 mmBTU
- ESS 61, Source EUI: 140.4 , Site EUI: 56.9
Test: Transfer 1000 mmBTU from electricity to natural gas or increase natural gas by 10,002 therms and decrease grid kWh by 293,083. Assumes equal energy use efficiency
- Zeroed out September kWh of 236,378 and decreased October by 56,705 from 139,465 kWh to 82,760 kWh
- Increase June usage from 0 therms to 10,002 therms
Results
- 2022 Energy Data shows 1,735,957 kWh and 26,292 therms or 5,923 mmBTU for grid electricity and 2,629 mmBTU for gas. Total 8,552 mmBTU
- ESS, 72 Source EUI: 128.7, Site EUI: 56.9
Sources:
https://portfoliomanager.energystar.gov/pdf/reference/Source%20Energy.pdf
https://www.pepco.com/SiteCollectionDocuments/Pepco%20DC%20Enviro%20Fuel%20Mix%20Insert_5.22_final_ADA.pdf