
We get this question quite a bit so thought we’d address it in our blog. Here’s how the argument goes: given that the price of solar panels continues to decline significantly each year, while their efficiency increases, it would stand to reason that someone could get a much better deal if they wait a few years to purchase panels or engage in a solar PPA. Let’s look at some trends to see if this theory makes sense. For this post we will test the following hypothesis: “I will profit more over a 20 year period by delaying a 50kW solar purchase from 2021 to 2026”
The price of solar panels over time
Back in 1977, the price per watt of a solar panel was around $76. Today, you can easily find panels at around 76¢ per watt. In other words, panel cost has fallen by 99% in 44 years. Extrapolate this out and we can say panel prices are falling by around 10% steadily each year. Pretty dramatic!
Efficiency of solar panels over time
Not only are panels becoming more affordable, but they’re also becoming more efficient. In other words, a watt of solar panels in 2021 produces more kilowatt hours than it did in any previous year. Based on data from the National Renewable Energy Laboratory, we can see that panels pretty consistently increase in efficiency by 0.5% each year. So by 2026, we can expect panels to produce 2.5% more energy per watt than they do today.
From this background, we can infer that you can get 12.5% more value each year you postpone your decision to go solar (10% less expensive plus 2.5% more efficient). So the longer you wait, the more you are rewarded. By simply waiting 5 years, you’ll get 80% more bang for your buck!
OK, let’s first acknowledge that using this reasoning, it would never make sense to go solar, as you’ll always get a better deal the following year. Setting aside this practical issue, let’s look at the bigger picture and bring in other critical factors.
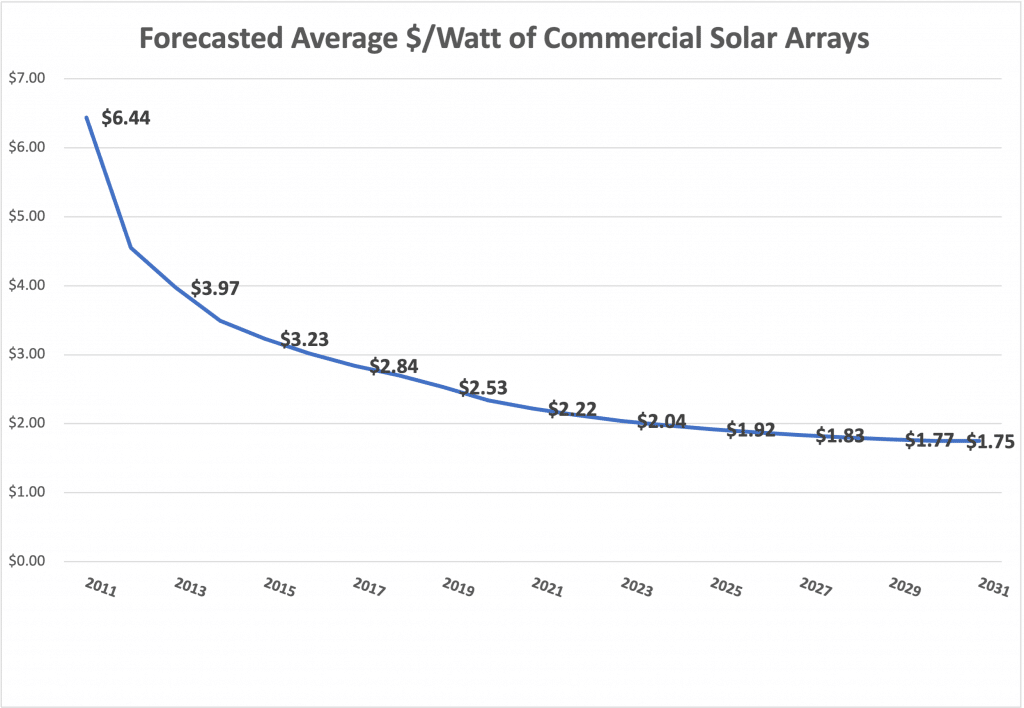
Total installed cost of solar over time
Panel costs are only a portion of the total cost of a solar array. A turnkey commercial scale array in DC will on average cost around $2.22/watt installed, meaning the panels account for 1/3rd of the total cost. The remainder is comprised of the other components (inverters, wires, racking, hardware), engineering, construction, permitting, and interconnection costs. When we look at the total installed cost over time, we see that while this total cost is declining, it declines at a much slower rate over time than the panels themselves. This makes sense given that many of these cost components actually increase in price over time. If we extrapolate this trend, we get the following chart and can expect a 50 kW system to cost $93,500 in 2026 ($1.87/w) vs $111,000 in 2021 ($2.22/w).
But what about solar incentives?
Unlike technological trends, incentives for solar are nearly impossible to predict given that they are based on political decisions. Typically, the Federal government has incentivized all new forms of energy at their genesis. Then, over time, incentives fade down as the technology becomes more competitive against older sources of energy. For the purposes of this analysis, we’ll look only at future incentives that are currently legislated. The federal government currently will contribute 26% of the installed cost. This will decline to 22% in 2023 and permanently drop to 10% for commercial systems and 0% for residential systems beginning in 2024.
In DC, we are fortunate to have a production based incentive system called Solar Renewable Energy Credits (SRECs). These prices are determined by a market based mechanism, wherein the supply is based on the amount of solar operating in DC and the demand is proportional to the Alternative Compliance Payments (ACPs) that conventional energy suppliers can pay instead of purchasing SRECs. For our financial model, we typically price the future value of SRECs at 83% of the ACP. In 2024, SREC values are expected to decline by 20%, followed by an additional 25% decline in 2027 as the ACP declines by this amount.
Oh and what about inflation and opportunity cost?
Every financial analyst will tell you that a dollar one year from now is worth less than a dollar is today. This is partially because inflation causes prices to increase, but it is also because of opportunity cost. For example, if you invested a dollar in in the S&P 500 index, on average your dollar would be worth $1.06 the following year (though it has been much higher in recent years). When we combine this 6% capital rate with an average inflation rate of 2%, we get a 8% discount rate. In other words, a dollar in your hand today is worth 8% more than a dollar you’ll receive a year from now.
Putting it all together
Now we have all the inputs needed to develop our financial model and test our hypothesis. Scenario A presents a 2021 solar investment’s cashflows over 20 years and Scenario B shows the same scenario for an array installed in 2026. We adjusted electric rates at the 2% inflation rate. On a purely nominal cash flow basis, taking advantage of today’s incentives yields an additional positive cash flow of $12,914.
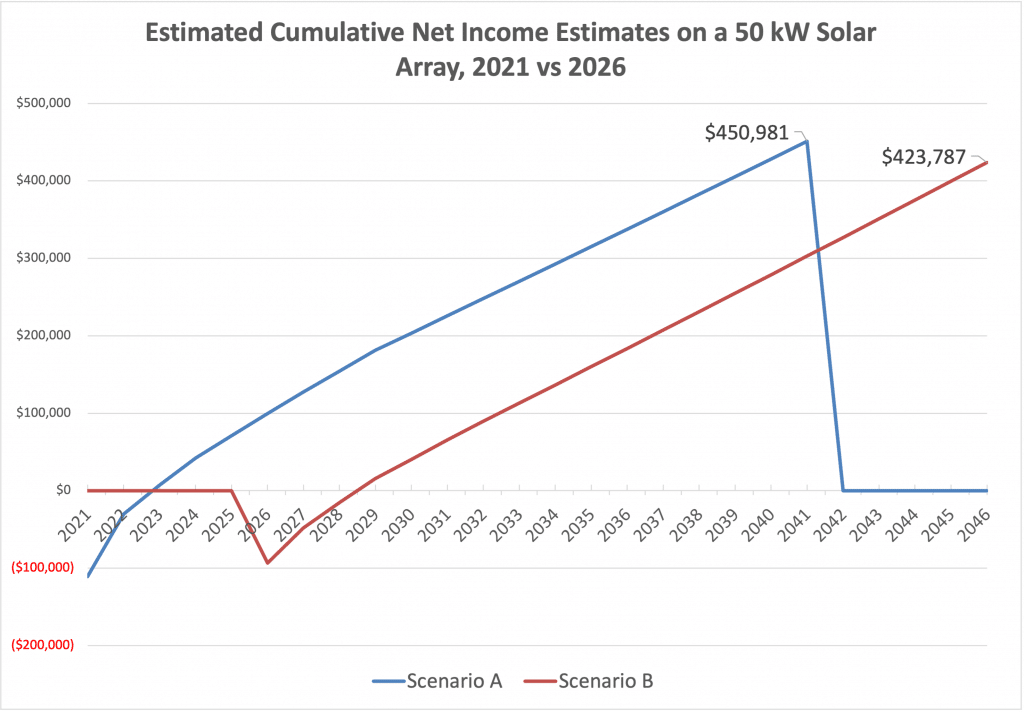
However, given the time value of money, we must account for the fact that Scenario A investor will be earning revenue in the immediate next 5 years whereas the Scenario B investor will not. People in real estate will be familiar with a metric called the “Internal Rate of Return” or IRR, which measures the return on investment adjusted for the years in which the revenue is realized. In essence, the IRR is equal to the discount rate at which the project would no longer be profitable. Investors generally choose their investments by which ones have the highest Internal Rates of Return. Comparing 20 year timelines, Scenario A (2021 array) has an IRR of 41%, but in Scenario B, the IRR falls to 38%.
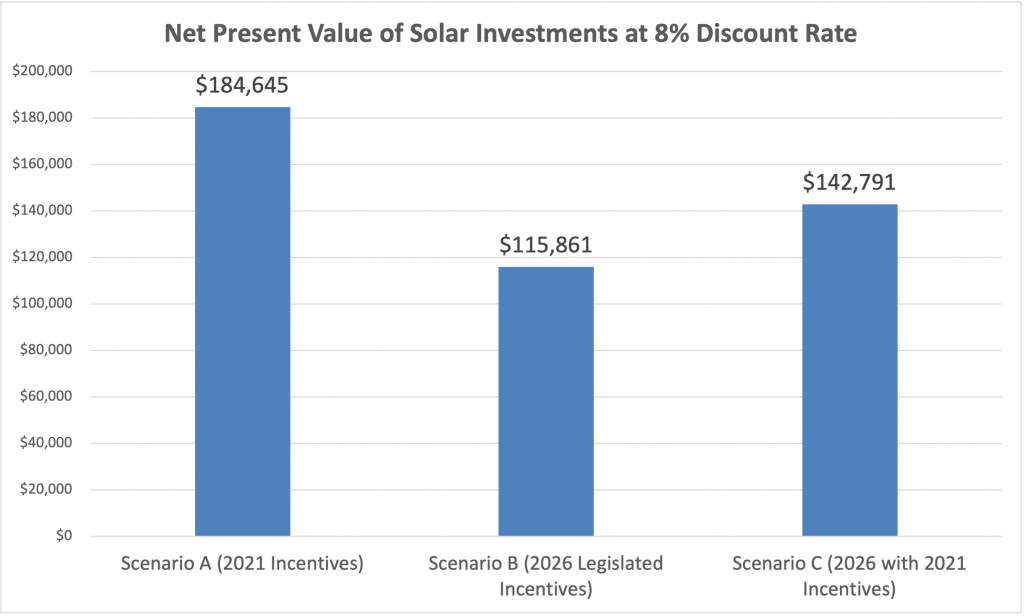
We can also apply the time value of money to cashflows by applying the 8% discount rate we posited earlier, which will give us the Net Present Value or NPV of each investment. This can be done easily in Excel using the “NPV” function in the formula bar. When we adjust for this, that Scenario A yields an NPV of $184,645 compared to $115,861 for Scenario B; a differential of 37%.
Now of course we don’t have a crystal ball and it seems a defensible premise that our local and national policymakers would delay these incentives to sunset. So let’s rerun the numbers for the 2026 start date and assume that all incentives are completely retained at 2021 levels and refer to this as Scenario C. Even with these rosy assumptions, the NPV on Scenario C is still only $142,791; 23% less than Scenario A, which uses more expensive and less efficient panels.
Conclusion
Even if you are considering engaging in a third party owned array, such as a PPA or lease, this is the type of analysis the solar provider will use to determine what your PPA rate will be. The longer you wait, the more you will be paying the full retail rate to Pepco or not earning any revenue from your roof.
We hope this post has helped you realize that there is indeed no time like the present to take advantage of the phenomenal investment that is solar in DC.