Solar Renewable Energy Credits (SRECs) remain the foremost driving force behind the deployment of solar PV in Washington, DC. What’s more, they are also the least understood and most difficult factor to forecast when modeling cash flows of a solar investment. This article will breakdown the components of how District of Columbia SRECs are priced in order to predict where prices may be heading.*
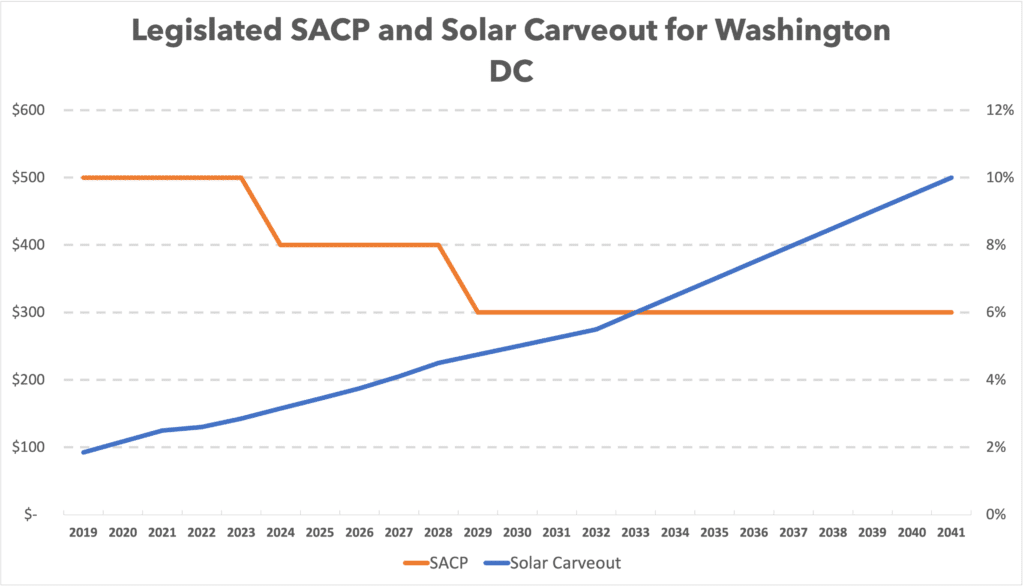
Like any other commodity in a market economy, prices for SRECs are based on supply and demand. Demand for SRECs is primarily determined by the Solar Alternative Compliance Payment (SACP) system, to which companies that supply electricity to DC consumers are subject. Suppliers must source an increasing percentage of electricity generated within the District from solar energy each year or pay the SACP. This is referred to as the “solar carveout”, which was prompted by the Renewable Portfolio Standard or RPS. See chart below:
The easiest way for most suppliers to source this energy is to purchase SRECs from solar PV system owners in DC. According to the DC Public Service Commission (PSC), there are a total of 47 companies that supply electricity to the District; 83% of which are purchasing SRECs to meet their RPS mandate.
As such, the demand for SRECs is a function of the total energy consumed in all of DC Pepcoland multiplied by the solar carveout. The specific amounts can be viewed in the graph above and increases over time. This is counterbalanced by the SACP declining over time. However, while the SACP is legislated to decline by 40% over the next decade, the solar carveout is legislated to increase by 157% in that same period, which will overall put upward pressure on SREC prices (though they will never exceed the SACP or energy suppliers would just pay the full penalty).
The other big factor in determining demand for SRECs is the total demand for electricity in DC. When aggregate demand for electricity declines, as it did during the pandemic lockdown, demand for SRECs also declines proportionately, and vice versa.
Now that we’ve gone through the demand side of the equation, let’s look at supply, which thankfully is much easier to measure. Supply is simply a function of how many total megawatt hours of solar energy are being generated within the DC Pepco territory (and the few eligible PV systems that lay outside DC). The amount of SRECs being generated has ramped up significantly over the past few years and didn’t seem to slow down at all from the pandemic. In fact, the amount of new PV coming online since 2018 has increased by 29% annually since 2018. This is no doubt a result of high SREC prices and does not seem able to sustain at this level as it will eventually put downward pressure on prices.
See the PSC’s chart below. The pink line represents the amount of solar electricity needed to fulfill the Renewable Portfolio Standard, while the blue line represents how much actual solar energy is being harvested. The closer the blue line gets to pink line, the further the price of SRECs will decline. This narrowing delta helps explain why SREC prices have declined by 6% this year.
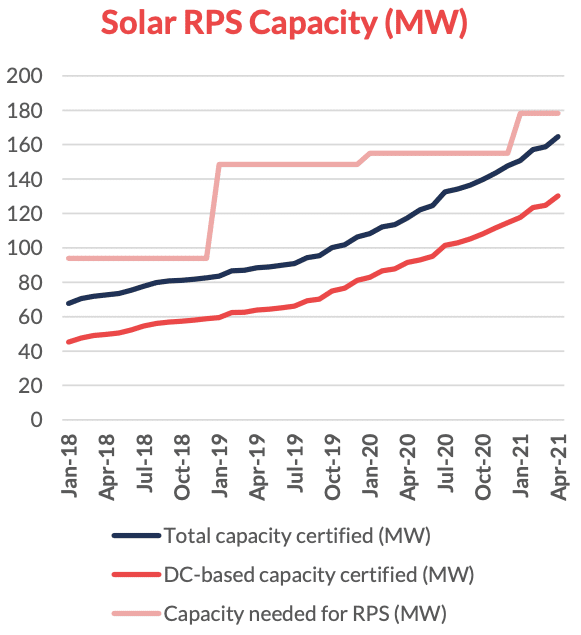
One of the more difficult factors to predict in this equation is where the pink line is heading. While we know the carveout is increasing, it’s very difficult to predict where total demand for electricity will be 5, 10, or 20 years from now. A quick glance at all the dozens of cranes around town or at the Zillow price listings shows that people are still flooding to DC. On the other hand, energy efficiency requirements on new constructions and the new Building Energy Performance Standards (BEPS) will mean that the buildings of the future will consume significantly less electricity than today’s current building stock, but this only applies for buildings over 50,000 square feet during the current 5 year compliance cycle. In the short term, we are already seeing the local tourism and hospitality industry recovering quickly to close to pre-pandemic levels, signaling a likely rise in total electric consumption.
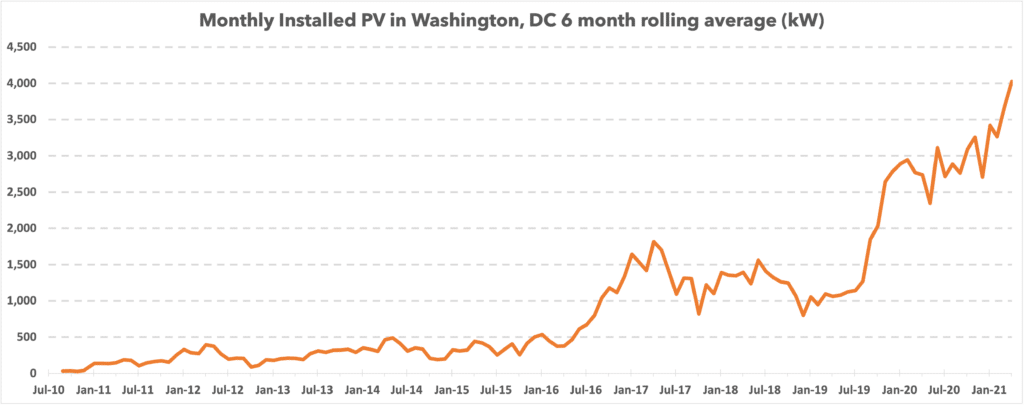
The other challenging prediction concerns where the blue line is heading. Below, we used data from the PSC to map out the average monthly kW added to the capacity and found we are currently in one of the longest sustained growth cycles in the history of DC’s PV market. The first growth period in mid-2016 coincided with Congress’s extension of the 30% Federal Investment Tax Credit (ITC) through 2019, which had previously been set to decline to 26% in 2016. This also helps explain the massive increase in new capacity installed in the second half of 2019 and bled into 2020 because of safe harbor provisions. The ITC is scheduled to decline to 22% at the end of 2022, so expect another surge in supply then.
The final factor that bears reference is the court decision in 2018 to grandfather in 1/3rd of all retail electric supply from being subject to the full SACP. This made a big impact 3 years ago when it was first determined and SREC prices tumbled by 15%. The amount of electric supply subject to this grandfathering was tapered down to 22% in 2020, 15% in 2021, and will be eliminated at the beginning of 2022 as the remaining grandfathered electric supply agreements expire. As such, expect some modest SREC price recovery in 2022, and expect a similar jump in demand in new systems at that time. There will be an even bigger drop at the end of 2023, when it declines to 10% for commercial scale arrays and 0% for residential arrays. This surge in expected demand will also coincide with the decline in the SACP by 20%. As such, expect a big drop in activity at the start of 2024.
Here’s a summary table of anticipated price factors we’ve just discussed and their expected impact on SREC values:
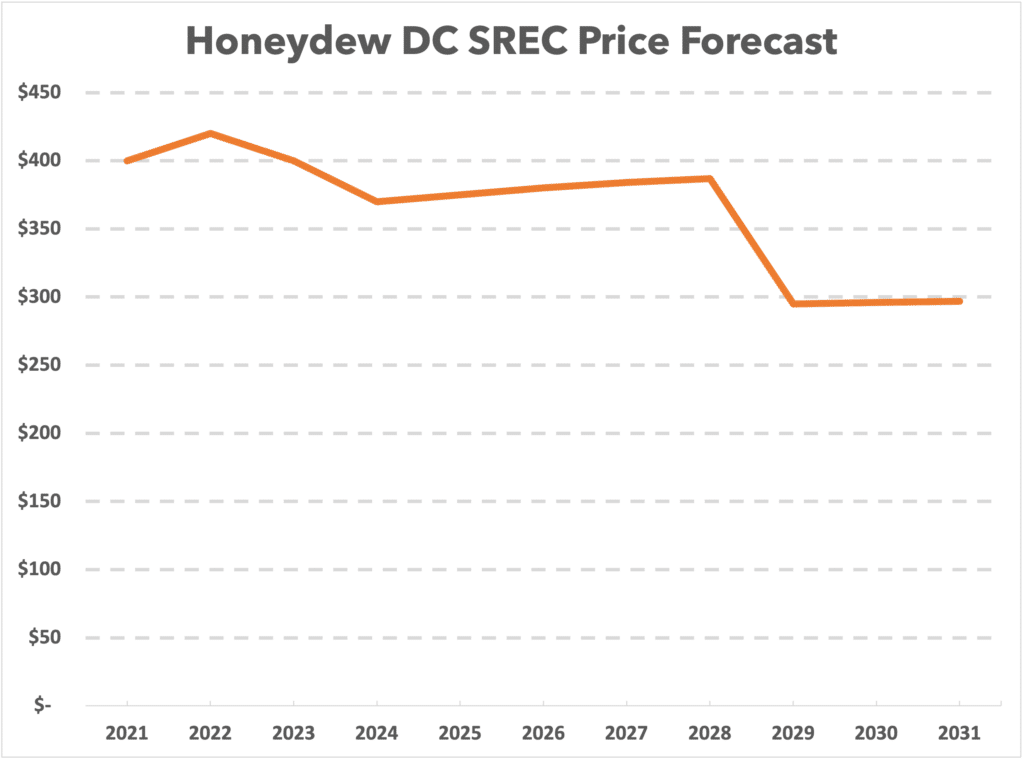
We now have enough information to develop a forecast. Forecasting any aspect of the energy markets is subject to many unforeseeable factors and unfortunately my crystal ball is in the shop. For example, who predicted oil prices would be negative in 2020? Despite this peril, here’s our best guess as to what to expect in the coming years for DC SREC prices, but again please take this forecast with a large grain of salt! Without further ado, here it is:
The one prediction we have a lot of confidence in is that the longer people delay their investments in solar, the lower the total return will be, primarily due to the declining ITC and SACP rates.
*Legal Disclaimer: This article is for entertainment purposes only and should not be considered financial or investment advice. Honeydew Energy Advisors, Corp assumes no responsibility or liability for any decisions made from information contained in this blogpost.